Hi, I'm Andy Niewiarowski
And I Love Data Science
About Me
Hi. I’m Andy Niewiarowski, and I work in data science. I started off with an interest in the human mind and AI. This led to me obtaining a bachelor's degree in psychology and a master’s degree in data science. I currently work at a small company
Since the company I work at is smaller, I’ve had to wear many hats and have experience going through the entire machine learning (ML) process. I’ve taken models all the way from data collection to deployment. I’ve built data pipelines using Azure Data Factory, created dashboards in Power BI, and deployed models with MLflow and Azure ML.
If you need an experienced data scientist with the skillset to carry out the entire machine learning process, contact me.
See ResumeWhat Does A Data Scientist Do?
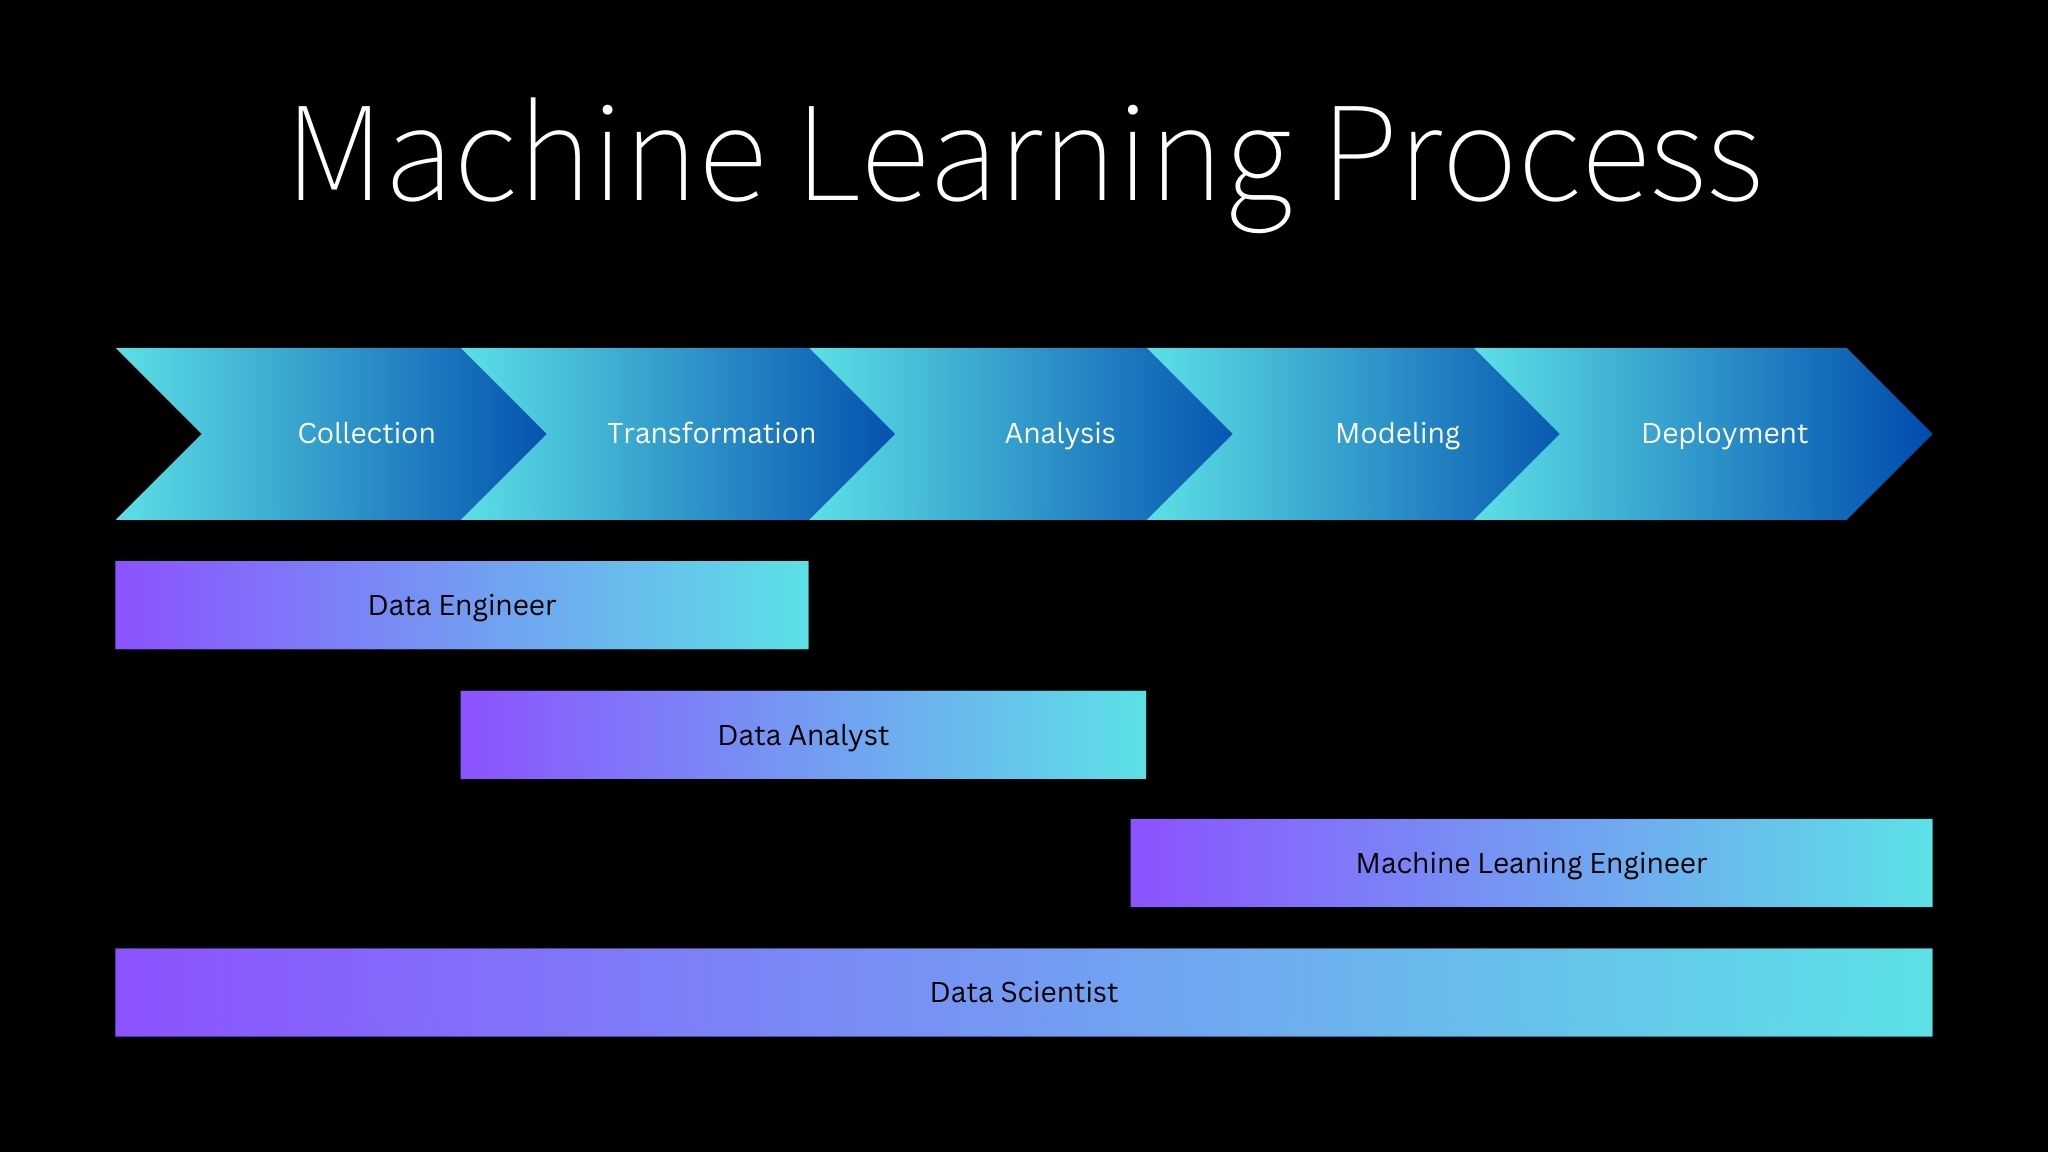
A data scientist collects data, analyzes data, and builds statistical/ML models. The models can be used for a variety of purposes, such as: forecasting, detecting fraud, acting as recommender systems, and generating images. Recently, the work of the data scientist has been divided up into three roles: the data engineer (collects data), the data analyst (analyzes data), and the machine learning engineer (models data). However, a skilled data scientist should be able to manage the entire machine learning process themselves.
Sample Project
The following project is a sample project used to demonstrate my knowledge of data science. It has two components: a data engineering section and data analysis section. The data engineering section showcases my ability to collect data and work with cloud platforms. This was done using Microsoft's Azure platform. The data analysis section showcases my ability to build dashboards and communicate findings. It was done using Microsoft Power BI. The project analyzes the Covid19 pandemic and uses data to predict the number of cases each week.
Data Engineering
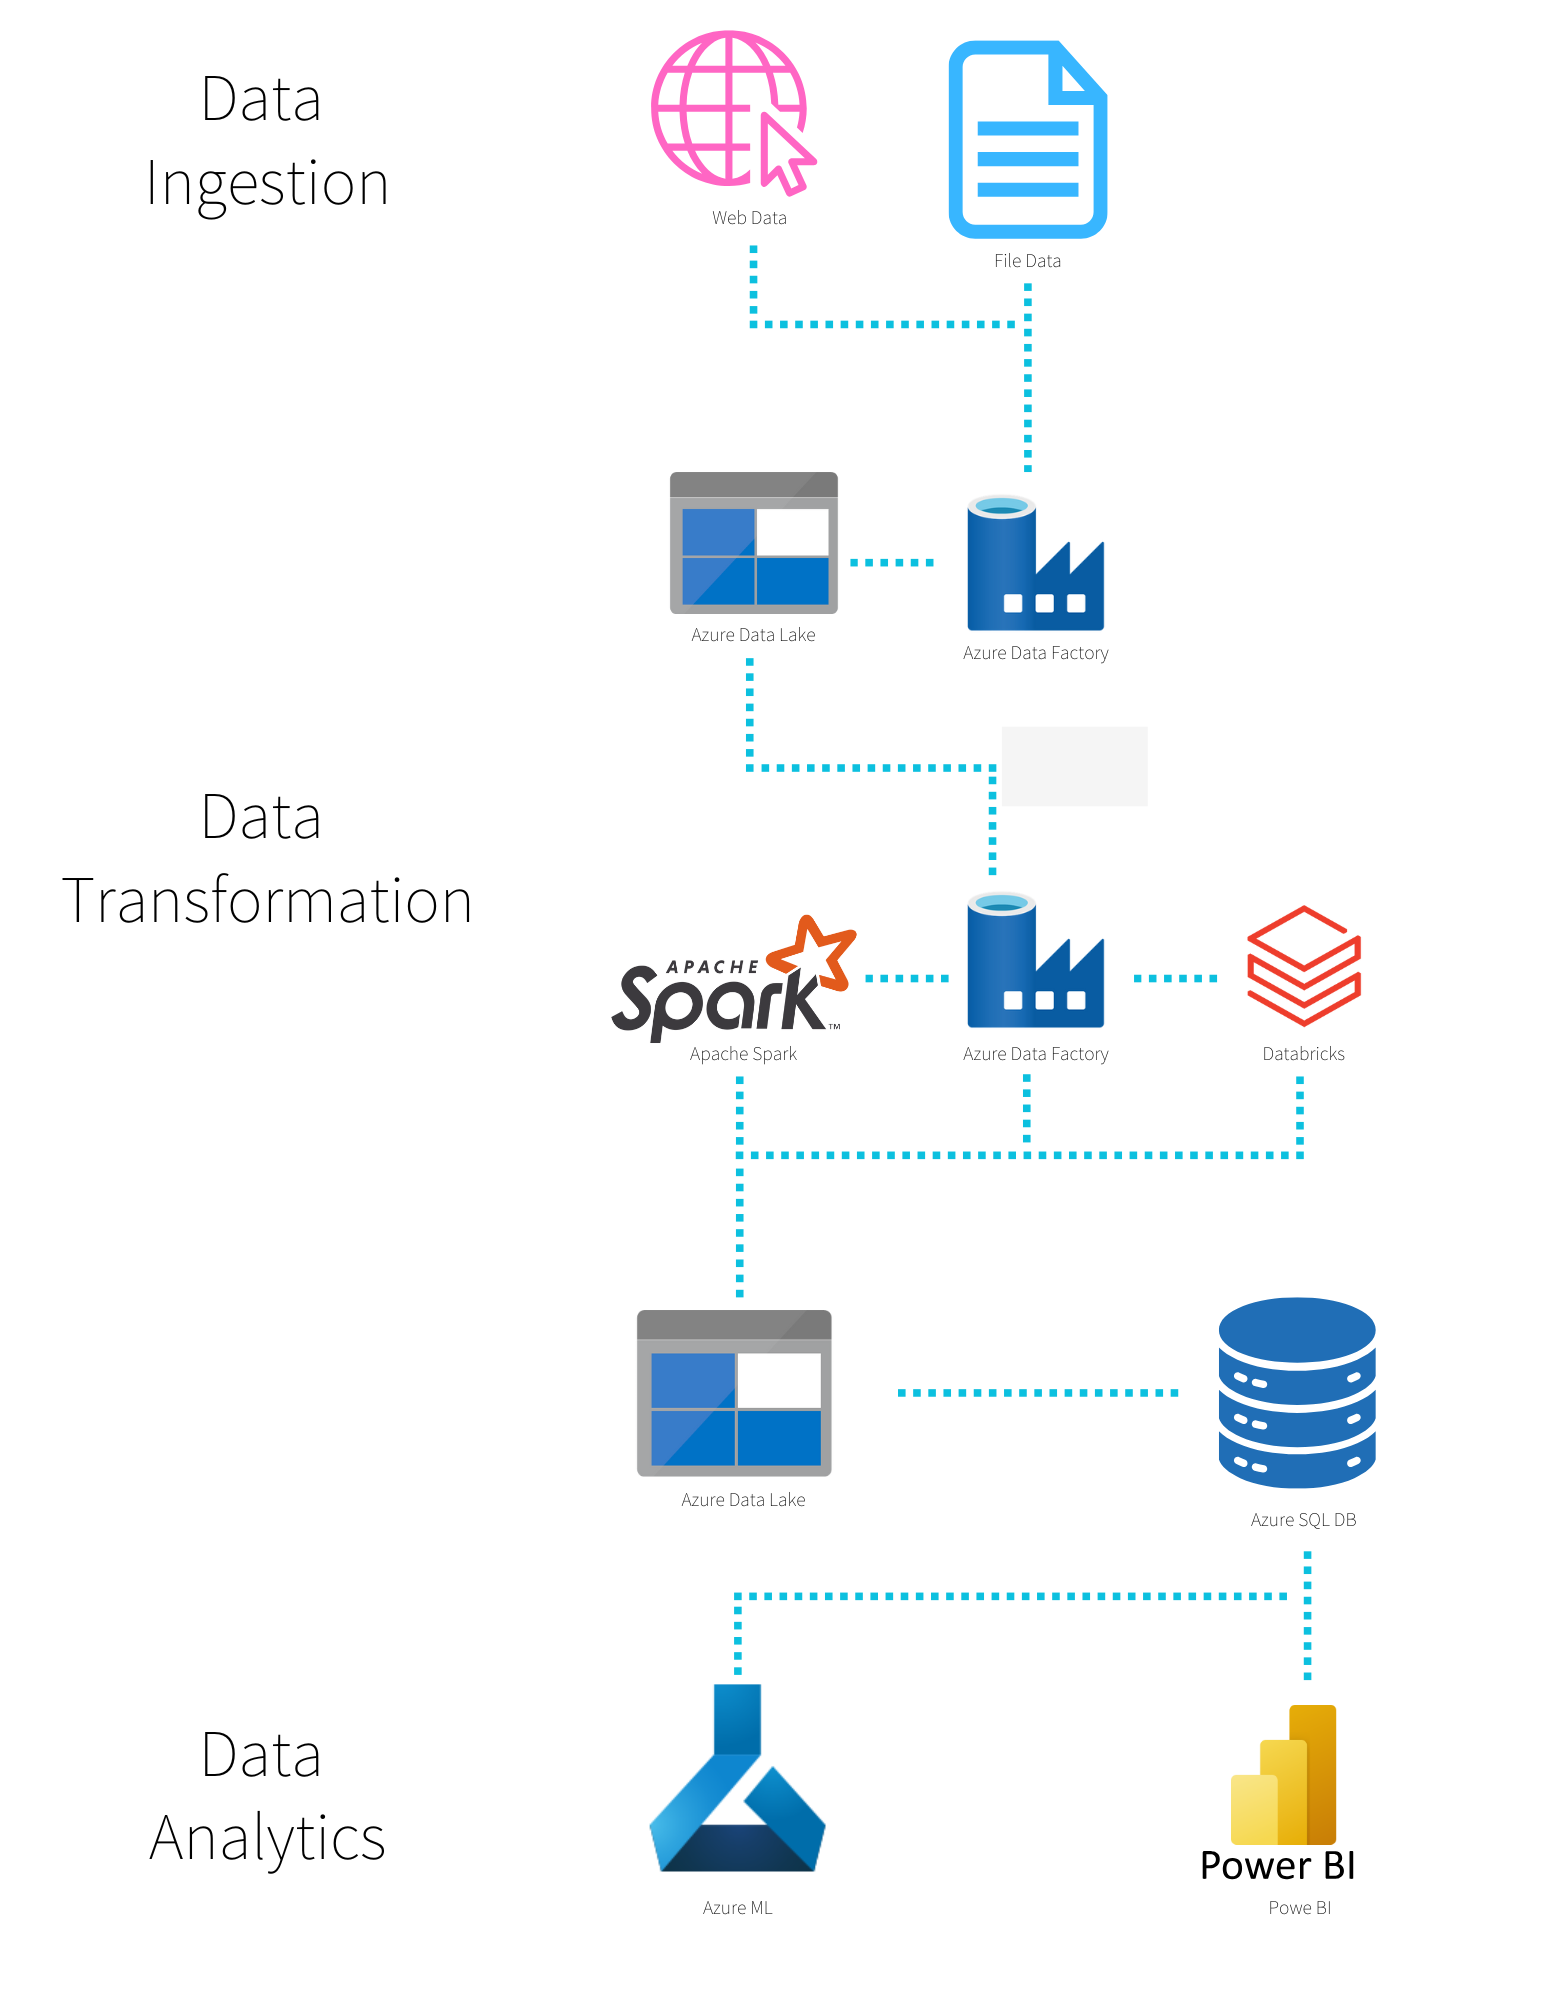
The data engineering section of this project was meant to grab data about the covid 19 pandemic in Europe from the European Centre for Disease Prevention and Control website. It also grabs population data by country from the eurostat website. This data was ingested into an azure data lake. The data was then transformed using a combination of azure data flow, databricks, and Apache Spark. The data was transformed from daily to weekly times. It was also segmented by country and age group. Once the data was transformed, it was piped into an Azure SQL database. The transformed data in this SQL database was used for data analysis and machine learning.
Data Analysis
The data analysis part of the project used dashboard built in power BI to look at the trends surrounding the COVID-19 pandemic in the year of 2020. The chart shows a spike in cases in October just as flu season was starting. However, the most deaths occurred in April, when the disease was much newer, and the vaccine had not been developed yet. The most testing was done in the United Kingdom and Western Europe. Less testing was done in Northern Europe and the Baltic region.